
Pittsburgh, Pennsylvania
Projects

Telecom Customer Churn Prediction: ML Pipeline with Neural Networks

image
March 18, 2022
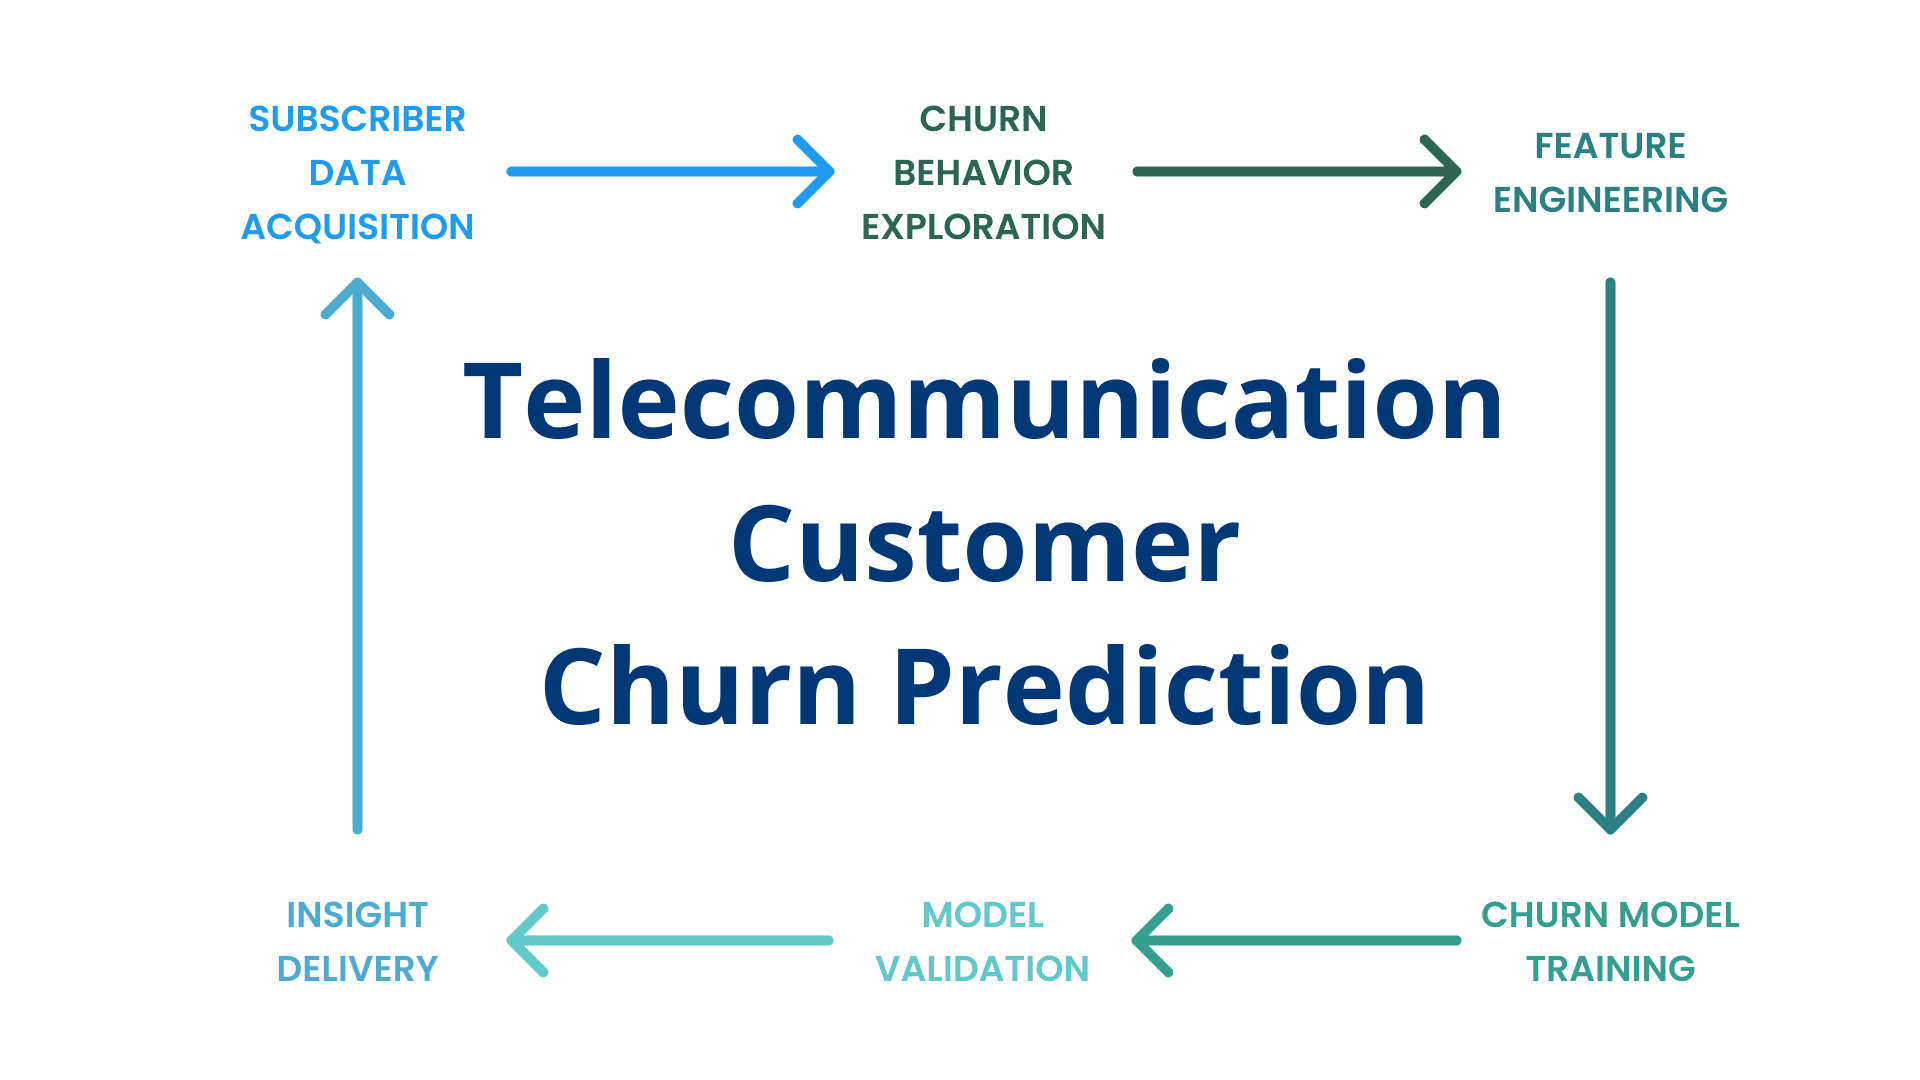
Telecom companies bleed money through churn. Every customer who walks out the door costs somewhere between 5x and 25x what it would take to just keep them happy. The industry loses 15 to 25 percent of its subscriber base annually. That math gets ugly fast. This project was my final year minors project at DJ Sanghvi College of Engineering. The goal was straightforward: build a pipeline that identifies customers likely to cancel their service before they actually do it. Give the retention team a head start. 7,043 customer records from a telecom provider. 21 features spanning three categories. Demographics cover the basics. Gender split is roughly even. 16.2% of the base are senior citizens. About half have partners and roughly 30% have dependents. Services paint the picture of what each customer subscribes to. Phone service, internet type (DSL vs fiber optic), add-ons like online security, device protection, tech support, streaming TV, streaming movies. Account information tells the financial story. Contract type (month-to-month, one year, two year), payment method, paperless billing, monthly charges ranging from $18.25 to $118.75, and tenure from brand new to 72 months. The target variable: churn. 26.5% of customers in this dataset left. The remaining 73.5% stayed. That imbalance matters and shapes every modeling decision downstream. 11 records had missing TotalCharges values. Those were dropped. The exploratory analysis surfaced patterns that any telecom exec would recognize but rarely quantifies this cleanly. Churners have a median tenure of about 10 months. Non-churners sit around 38 months. The first year is when you lose people. If a customer makes it past month 12, they are significantly more likely to stick around. This alone suggests that onboarding and early engagement programs would have outsized impact on retention. Fiber optic customers churn more than DSL customers. At first glance that seems backwards. Premium service, premium churn? The data suggests it comes down to price sensitivity combined with higher expectations. Fiber optic subscribers pay more ($80+ median monthly charges for churners) and when the service does not meet expectations, they leave faster. DSL customers pay less and tolerate more. Month-to-month contracts show dramatically higher churn rates compared to one-year or two-year agreements. No surprise there. But the magnitude is worth noting. Month-to-month is essentially the default "I can leave whenever I want" arrangement. The friction of a contract keeps people around even when they are mildly dissatisfied. Customers without online security or tech support churn at higher rates. These add-ons create stickiness. Whether that is because engaged customers are more likely to buy add-ons in the first place or because the add-ons genuinely increase satisfaction is a question worth exploring. Either way, bundling these services for at-risk segments could help. Electronic check users churn the most. Automatic payment (credit card or bank transfer) users churn the least. Automatic payment creates inertia. People do not cancel what they do not think about each month. Binary features like gender and partner status got label encoded. Multi-class categoricals (internet service type, contract type, payment method) went through one-hot encoding. Numerical features (tenure, monthly charges, total charges) were standardized with StandardScaler. This matters most for distance-based algorithms like KNN and SVM where feature scale directly affects predictions. Correlation analysis helped identify redundant features. The final feature set balanced signal with parsimony. Train-test split: 80/20. Stratified to preserve the 26.5% churn ratio in both sets. KNN is simple and interpretable. GridSearchCV found the optimal k value. The model captures local patterns well but struggles with the high dimensionality of one-hot encoded features. Performance was the weakest of the five: 0.76 accuracy, 0.79 AUC. Tested both L1 (Lasso) and L2 (Ridge) regularization. L2 performed better on this dataset. Logistic Regression ended up being one of the strongest models here, which says something about the data. When a linear decision boundary works well, the underlying relationships are relatively clean. 0.79 accuracy, 0.83 AUC. Highest AUC alongside the neural network. The real advantage: interpretability. Coefficients directly tell you which features push a customer toward churn. Contract type, tenure, and fiber optic service consistently showed the largest coefficients. 200 trees, max depth tuned via RandomizedSearchCV across n_estimators, max_depth, max_features, and splitting criterion. Random Forest handled the nonlinear interactions between features well and proved robust against overfitting. 0.77 accuracy, 0.81 AUC, 0.53 F1. Feature importance from the Random Forest confirmed the EDA findings. Contract type, tenure, and monthly charges dominated. SVM with GridSearchCV tuning over C values and kernel selection. Performance landed at 0.79 accuracy, 0.82 AUC, 0.58 F1. Competitive with Logistic Regression. The RBF kernel captured some nonlinear patterns that the linear model missed, but the improvement was marginal. The deepest model in the lineup. Six dense layers: 1024, 768, 512, 256, 128, and a single output neuron with sigmoid activation. Dropout layers between each dense layer to control overfitting. ModelCheckpoint saved the best weights during training. The neural network achieved the highest accuracy at 0.80 and tied for the highest AUC at 0.83. F1 score of 0.59 was also the best across all models. But the margin over Logistic Regression was slim, and the interpretability tradeoff is real. The results tell an interesting story about complexity versus performance on this scale of data.
ModelAUCF1Accuracy
K-Nearest Neighbors0.790.530.76
Logistic Regression0.830.570.79
Random Forest0.810.530.77
Support Vector Machine0.820.580.79
Feed-Forward Neural Network0.830.590.80
AUC matters more than accuracy here because the classes are imbalanced. A model that predicts "no churn" for everyone would hit 73.5% accuracy and be completely useless. AUC captures discriminative ability regardless of threshold. The neural network edges out every other model but by thin margins. Logistic Regression sits just 1 point behind on accuracy and ties on AUC. For a production deployment where explainability matters, Logistic Regression is probably the right call. For raw predictive power, the neural network wins. A few directions that would push this further. Real-time scoring. Integrate the model into a CRM system so retention teams get alerts when a customer's churn probability crosses a threshold. Batch predictions are fine for analysis but proactive retention needs real-time. A/B testing. Use the model to identify high-risk segments, then test different retention interventions (discounts, contract upgrades, add-on bundles) and measure actual impact on churn rates. Customer lifetime value. Not all churn is equal. Losing a $120/month customer hurts more than losing a $20/month one. Weighting predictions by CLV would help prioritize retention spend. Temporal modeling. This dataset is a snapshot. Time-series approaches that track how customer behavior changes month over month could catch deteriorating satisfaction before it becomes churn. Python, pandas, NumPy, scikit-learn, Keras, TensorFlow, Matplotlib, Seaborn (FiveThirtyEight style), GridSearchCV, RandomizedSearchCV, Jupyter Notebook.